-
Remember the COVID toll in Tennessee on this ‘more normal’ Thanksgiving
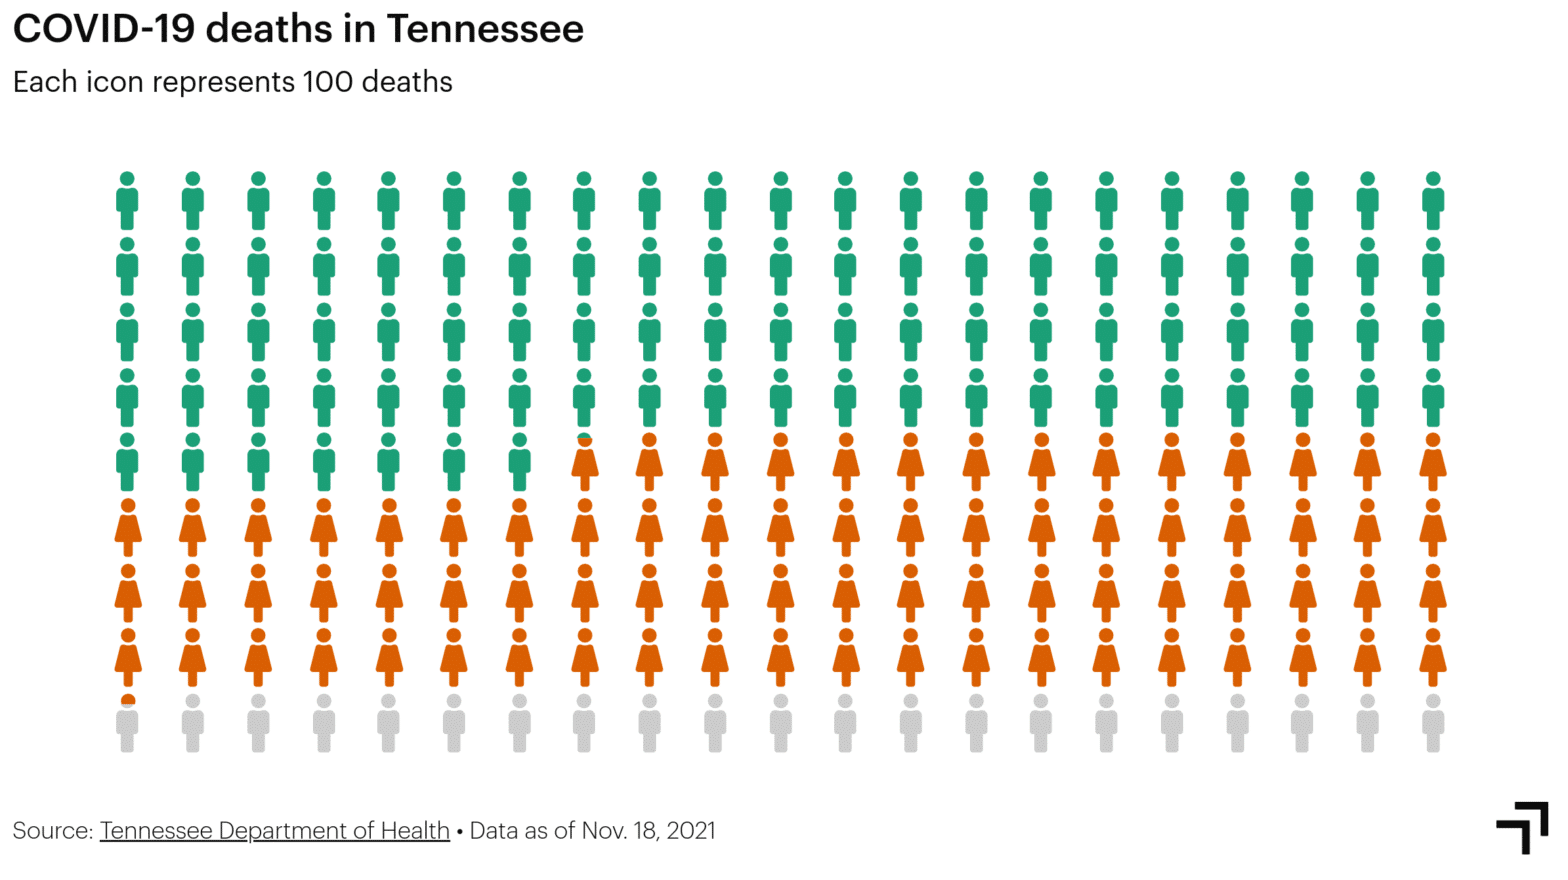
While Tennesseans look toward enjoying a more normal Thanksgiving Holiday this week with family feasts and fellowship, take a moment to remember the those who have died of COVID-19 during the pandemic and to ponder what is yet to come. As of last Thursday, 7,708 women and 9,113 men have died of COVID in Tennessee,…
-
COVID-19 vaccinations by day in Knox County
Here’s a look at how COVID-19 vaccinations are going in Knox County, according to the Tennessee Deparmtent of Health. They can’t come fast enough; the rolling seven-day average as of Dec. 21 was 23.11% of the coronaivrus tests were coming back positive. (Simple visualization using Google Flourish.)

